
How to read and use compressor flow maps

Thread Starter
Senior Member

Joined: Jul 2001
Posts: 691
Likes: 0
From: parkville, md
Vehicle: 1997 accent L
This is something i've been doing a lot of recently as I narrowed down my choices for a turbocharger. Its isnt that hard, alls it requires is being to do basic algebra to do the equations necessary (though it takes a good bit of thermodynamics and heat transfer to actually understand wtf everything means). I'll try to keep this as simple and as dumbed down as possible (i'm an engineering major, so I live and breath this stuff).
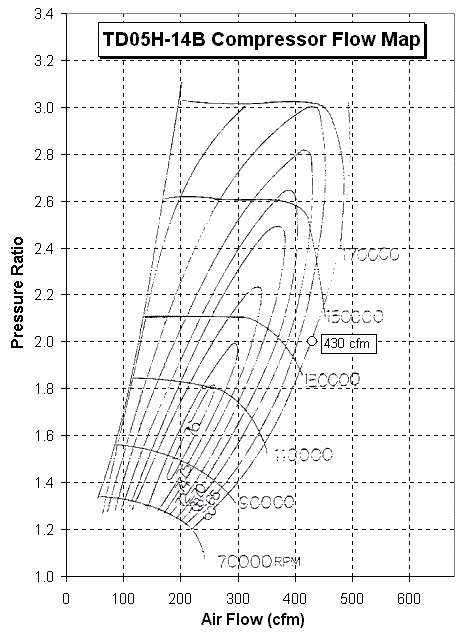
Turbo compressor maps are scaled with the vertical axis being the pressure ratio [which is the quantity you get from this: (14.7+boost pressure)/14.7] and the horizontal axis is usually either scaled in Volume Air Flow (Cubic Feet per Minute aka CFM, Cubic meters per second, etc) or Mass Air Flow (kilograms per second aka kg/s or the semi incorrect pounds per minute). I say pounds per minute is somewhat incorrect because pounds is not a unit of mass, its a unit of weight (mass x gravity), but I digress... Here's what the turbo map for the OEM 5spd 1g DSM turbo, the TD05-14B, looks like with CFM along the horizontal axis:
Now a compressor flow chart is fine and dandy, but what good is it without any data points? This is where the all that math garbage comes into play. For this map, we need to know your engine's CFM, but we arent boosted, and we dont know anyone that is boosted with similar engine and a datalogger. Have no fear, we can use this simple equation:
VAF = (L/28.328) x (RPM/2) x VE
-VAF is volume air flow, in this case CFM
-L is your engine's displacement in liters
-RPM is the rpm you're looking at
-VE is volumetric efficiency, guestimate at 80-90% for most 4 valve import motors.
This will give you your engine's stock airflow at any given RPM if you keep VE constant (I usually guestimate with 85%, this isnt rocket science wink ). For a 1.6L engine that redlines at 6500rpm, the equation will end up like this:
CFM = (1.6/28.328) x (6500/2) x .85
CFM = 156ft^3/min in our engine.
Thats all fine and dandy at with no boost, but that figure will be off for a boosted engine. To get your aiflow under boost you need to multiply your n/a CFM by your pressure ratio. Lets go with 1.6 in this case, making our boosted CFM ~250ft^3/min.
You should get at least two more airflow points for a certain rpm, one your boost threshold ie the point you begin making boost (PR=1) and the rpm point where you think full boost will occur. This should be at least half redline, but at least 1500-2000rpm away from idle. I used 2500rpm and 3000rpm respectively and got 60 and 115ft^3/min. With your three points, (250,1.6), (115,1.6), and (60,1), its time to head back to the flow map. Plot the points on the map just the way you made graphs in high school (see you'll use that stuff eventually wink ) and play connect the dots. Using our TD05-14B map it should look like this:

A decent fit, but a tad large. Lets try to OE 1g DSM autotragic turbo, the TD04-13g:

See how that turbo is a much better fit because the majority of the flow curve (the line you drew) is in the turbos best efficiency range? Thats a damn good match for this engine.
Hope all this mess helps!
Oh yeah, a good way around all the math is using the calculator (and flow charts and other information) on www.stealth316.com 's tech page:
http://www.stealth316.com/1-tech
Turbo compressor maps are scaled with the vertical axis being the pressure ratio [which is the quantity you get from this: (14.7+boost pressure)/14.7] and the horizontal axis is usually either scaled in Volume Air Flow (Cubic Feet per Minute aka CFM, Cubic meters per second, etc) or Mass Air Flow (kilograms per second aka kg/s or the semi incorrect pounds per minute). I say pounds per minute is somewhat incorrect because pounds is not a unit of mass, its a unit of weight (mass x gravity), but I digress... Here's what the turbo map for the OEM 5spd 1g DSM turbo, the TD05-14B, looks like with CFM along the horizontal axis:
Now a compressor flow chart is fine and dandy, but what good is it without any data points? This is where the all that math garbage comes into play. For this map, we need to know your engine's CFM, but we arent boosted, and we dont know anyone that is boosted with similar engine and a datalogger. Have no fear, we can use this simple equation:
VAF = (L/28.328) x (RPM/2) x VE
-VAF is volume air flow, in this case CFM
-L is your engine's displacement in liters
-RPM is the rpm you're looking at
-VE is volumetric efficiency, guestimate at 80-90% for most 4 valve import motors.
This will give you your engine's stock airflow at any given RPM if you keep VE constant (I usually guestimate with 85%, this isnt rocket science wink ). For a 1.6L engine that redlines at 6500rpm, the equation will end up like this:
CFM = (1.6/28.328) x (6500/2) x .85
CFM = 156ft^3/min in our engine.
Thats all fine and dandy at with no boost, but that figure will be off for a boosted engine. To get your aiflow under boost you need to multiply your n/a CFM by your pressure ratio. Lets go with 1.6 in this case, making our boosted CFM ~250ft^3/min.
You should get at least two more airflow points for a certain rpm, one your boost threshold ie the point you begin making boost (PR=1) and the rpm point where you think full boost will occur. This should be at least half redline, but at least 1500-2000rpm away from idle. I used 2500rpm and 3000rpm respectively and got 60 and 115ft^3/min. With your three points, (250,1.6), (115,1.6), and (60,1), its time to head back to the flow map. Plot the points on the map just the way you made graphs in high school (see you'll use that stuff eventually wink ) and play connect the dots. Using our TD05-14B map it should look like this:
A decent fit, but a tad large. Lets try to OE 1g DSM autotragic turbo, the TD04-13g:
See how that turbo is a much better fit because the majority of the flow curve (the line you drew) is in the turbos best efficiency range? Thats a damn good match for this engine.
Hope all this mess helps!
Oh yeah, a good way around all the math is using the calculator (and flow charts and other information) on www.stealth316.com 's tech page:
http://www.stealth316.com/1-tech